frequencies
How to read an audiogram: thresholds, the dB-HL scale, and what 'normal' means
Decode your audiogram. The dB-HL scale, frequency axis, air vs bone conduction, red and blue symbols, and where the speech banana lives.
Published May 21, 2026 · By the EarLabs editorial desk
An audiogram is a graph of your hearing thresholds across a range of frequencies. It is the primary output of a standard hearing test. Audiologists read audiograms fluently, but for the patient who receives a printout after their appointment, the chart can look cryptic. This guide walks through every element of a standard audiogram in plain language.
The two axes
Every audiogram has the same basic structure. Understanding the two axes is the foundation of reading the chart.
The horizontal axis: frequency
The horizontal axis represents frequency, measured in Hertz (Hz). This is the pitch of a sound. The scale runs from low frequencies on the left to high frequencies on the right.
Most clinical audiograms test six to eight standard frequencies: 250 Hz, 500 Hz, 1000 Hz (1 kHz), 2000 Hz (2 kHz), 3000 Hz (3 kHz), 4000 Hz (4 kHz), 6000 Hz (6 kHz), and 8000 Hz (8 kHz).
For context: a piano’s middle A is 440 Hz. A telephone dial tone sits around 350-440 Hz. The consonants of speech, such as s, sh, and f sounds, occupy the 2000 to 8000 Hz range. The vowel sounds occupy the lower frequencies.
The vertical axis: hearing level in dB-HL
The vertical axis represents hearing level in decibels, using the dB-HL scale (hearing level). This scale is calibrated to normal human hearing rather than to absolute physical sound pressure.
Zero dB-HL is defined as the level at which the average young adult with normal hearing can just detect a tone. This is not silence; it represents the softest audible level for a statistically typical ear.
The scale runs from -10 dB-HL at the top to 120 dB-HL (or sometimes higher) at the bottom. Crucially, the audiogram is plotted with the top representing better hearing and the bottom representing worse hearing. A threshold plotted higher on the page means the patient could hear softer sounds; a threshold plotted lower means a louder sound was required.
This inverted convention is counterintuitive at first but is the global standard for audiogram presentation.
What counts as normal hearing
Audiologists classify hearing according to where thresholds fall on the dB-HL scale. The NIDCD and WHO both use broadly consistent classification systems:
- Normal: 0 to 25 dB-HL
- Mild hearing loss: 26 to 40 dB-HL
- Moderate hearing loss: 41 to 55 dB-HL
- Moderately severe: 56 to 70 dB-HL
- Severe: 71 to 90 dB-HL
- Profound: 91 dB-HL and above
A hearing threshold of 25 dB-HL means that a tone had to be increased to 25 decibels above the average normal threshold before the patient could detect it. The worse the hearing, the lower on the audiogram the thresholds appear.
Most clinicians describe hearing by the range and pattern of the loss rather than by a single number.
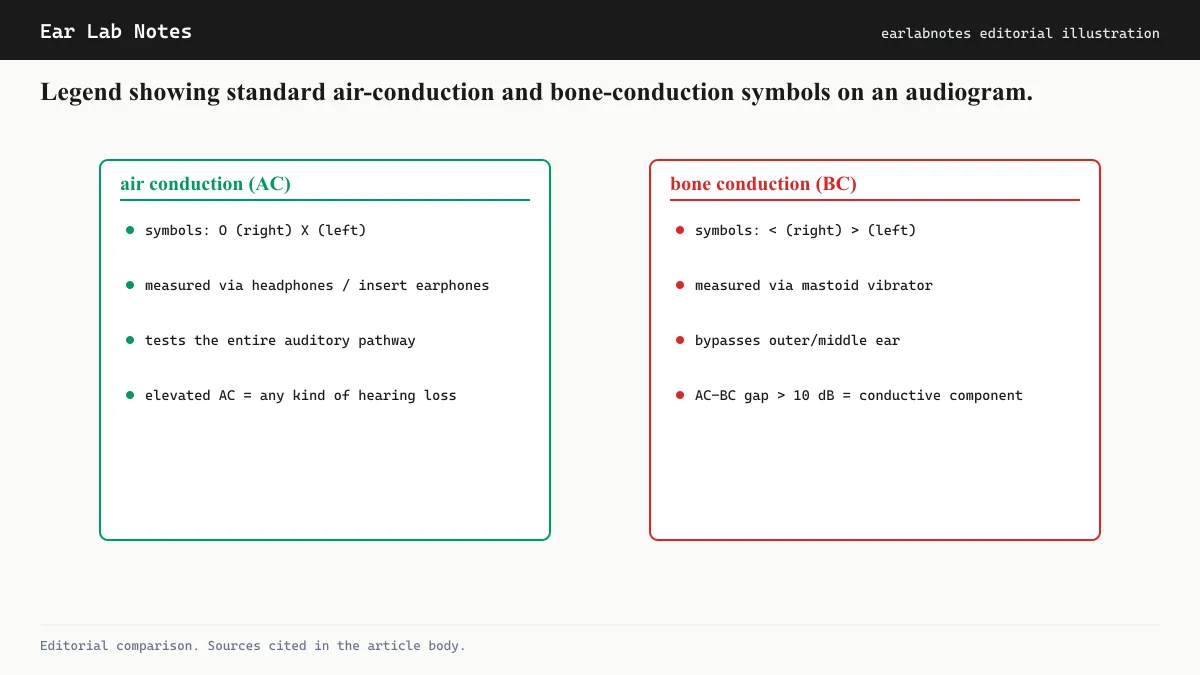
The symbols: red O, blue X, and brackets
Audiograms use standardized symbols to represent different types of measurements. Getting familiar with these symbols is the key to reading beyond the thresholds to understanding their type.
Air conduction is tested through insert earphones or over-the-ear headphones. Sound travels through the outer ear canal, the middle ear (eardrum and ossicles), and into the cochlea. Air conduction thresholds represent the entire ear system.
- Right ear air conduction: plotted as a red circle (O)
- Left ear air conduction: plotted as a blue X
Bone conduction is tested by placing a small vibrator against the bone behind the ear (the mastoid) or on the forehead. Sound bypasses the outer and middle ear and goes directly to the cochlea through skull vibration. Bone conduction thresholds reflect cochlear and auditory nerve function only.
- Right ear bone conduction: plotted as a red < or [
- Left ear bone conduction: plotted as a blue > or ]
Reading the air-bone relationship
Comparing air-conduction and bone-conduction thresholds at the same frequency tells you where in the ear the problem lies.
When air-conduction and bone-conduction thresholds are similar, and both are elevated, this is sensorineural hearing loss. The cochlea or auditory nerve is not functioning normally.
When air-conduction thresholds are worse than bone-conduction thresholds (creating an air-bone gap), this is conductive hearing loss. The outer or middle ear is not transmitting sound efficiently to the cochlea, which itself is working normally.
When both types of loss are present together, it is called mixed hearing loss.
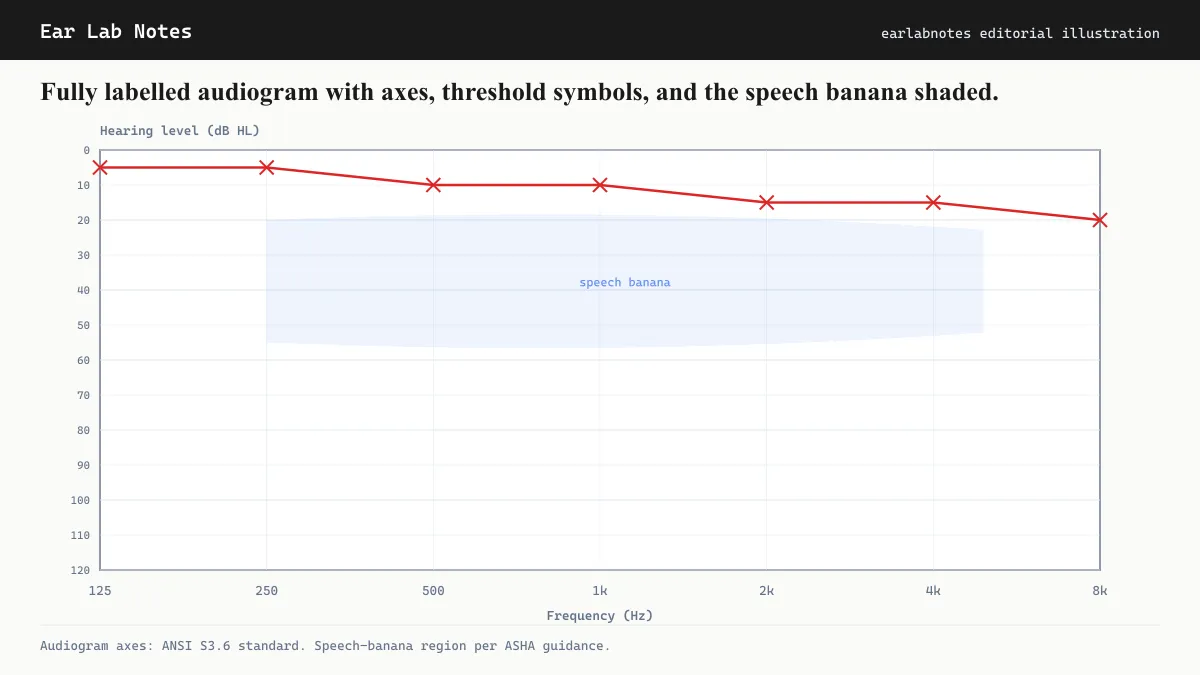
The speech banana
The speech banana is the region of the audiogram that encompasses the frequencies and volumes of the sounds of spoken language. It is called a banana because of its shape when drawn on the standard audiogram grid.
Conversational speech typically occupies the frequency range from about 250 Hz to 4,000 Hz, and the intensity range from about 20 to 60 dB-SPL (roughly 35 to 75 dB-HL in audiogram terms). Different speech sounds occupy different parts of this region. Vowels are lower in frequency and louder. Fricatives like s and f are higher in frequency and quieter.
If a patient’s hearing thresholds fall within or below the speech banana at any frequency, they may have difficulty detecting some speech sounds unaided. Thresholds worse than the bottom of the speech banana at high frequencies indicate that the quiet, high-pitched consonants will be missed or distorted.
Comparing four audiogram patterns
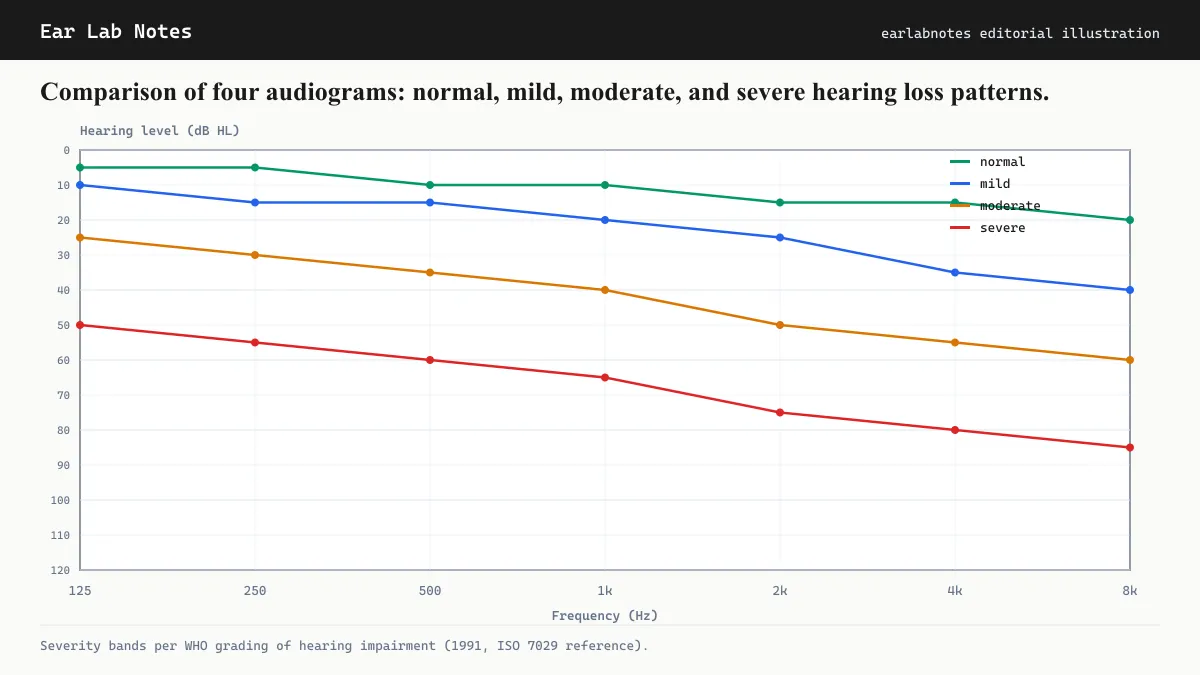
A normal audiogram shows thresholds at or better than 25 dB-HL across all tested frequencies. A mild sloping high-frequency loss shows normal thresholds at low frequencies but declining thresholds above 2,000 Hz. This is the classic early pattern of noise-induced or age-related loss. A moderate flat loss shows elevated thresholds across all frequencies at a similar level. A severe audiogram shows thresholds in the 70 to 90 dB-HL range, indicating that most conversational speech is inaudible without amplification.
What audiograms do not capture
A standard audiogram has well-recognized limitations. It tests frequencies from 250 to 8,000 Hz. Damage above 8,000 Hz (the extended high-frequency range) is not captured. It measures thresholds (the softest sound detectable), not suprathreshold processing quality.
Cochlear synaptopathy, sometimes called hidden hearing loss, can be present with a normal standard audiogram. In this condition, damage to the synapses between hair cells and auditory nerve fibers impairs processing without shifting detection thresholds. Patients may report difficulty understanding speech in noisy environments despite a clean audiogram. This limitation is an active area of research at institutions including the NIDCD.
If symptoms persist or change, see an audiologist or physician.
Watch: Understanding Audiometry and Audiograms
Source: Geeky Medics on YouTube
Transcript / summary
Frequently asked questions
- What does it mean if my audiogram shows 'normal' hearing?
- Normal hearing on a standard audiogram is typically defined as thresholds of 25 dB-HL or better across the tested frequency range (250 to 8000 Hz). However, a normal audiogram does not rule out all auditory problems. Cochlear synaptopathy (hidden hearing loss) and extended high-frequency damage can be present with a normal standard audiogram. If you have tinnitus or difficulty with speech in noise despite a normal audiogram, discuss further evaluation with an audiologist.
- Why is louder at the bottom of the audiogram?
- The vertical axis of an audiogram is deliberately inverted from what most people expect. The top of the axis (0 dB-HL and above) represents the threshold that people with normal hearing can detect. Lower on the page means louder stimuli were needed to reach threshold, representing worse hearing. This convention is used so that better hearing results appear near the top of the chart.
- What is the speech banana on an audiogram?
- The speech banana is a region on the audiogram that encompasses the frequencies and intensities at which the sounds of conversational speech occur. It is called a banana because of its curved banana shape when plotted on the audiogram grid. Hearing thresholds that fall within or worse than the speech banana suggest that unaided comprehension of normal conversation is affected.
- What is the difference between a conductive and sensorineural hearing loss on an audiogram?
- Conductive hearing loss shows worse thresholds for air-conducted sound (tones through earphones) than for bone-conducted sound (a vibrator placed on the skull). This gap between the two, called an air-bone gap, indicates that sound is not reaching the cochlea efficiently through the outer or middle ear. Sensorineural hearing loss shows similarly reduced thresholds for both air and bone conduction, indicating the problem lies in the cochlea or auditory nerve itself.
- What does masking mean on an audiogram?
- Masking refers to noise presented to the ear not being tested to prevent it from detecting the test signals meant for the other ear. Without masking, a very loud tone presented to a poor ear might be heard by the better ear through bone conduction, giving a falsely good result. Masking prevents this cross-hearing. Audiograms with masking applied use bracketed symbols to indicate masked measurements.
EarLabs Notes
One short note a week. Tinnitus and hearing health.
New tools, plain-language summaries of recent research, no spam. Unsubscribe in one click.
No tracking pixels, no behavioral retargeting. Read our privacy notes.
Primary sources
- How Is Hearing Loss Diagnosed? — NIH/NIDCD
- Hearing Loss — Mayo Clinic
- Hearing tests — NHS UK
- Clinical Practice Guideline: Tinnitus — American Academy of Otolaryngology - Head and Neck Surgery (AAO-HNS)